
Close reading of the week: Towards a Study of Information Geographies
By Jesse van der Merwe,
Foreword
This week we were asked to read Graham et al’s paper “Toward a study of information geographies” [1] and then write a close reading about the text. With this being the first ‘real’ academic week since the national lockdown, I was eager to try get back into some sort of productive workspace (mentally at least). This turned out to be a bit more challenging than predicted, as it was very hard to sit down and just write. However, I feel that this close reading was a fantastic starting point (thank you Hanli) as it gently compelled me to critically engage with just a something.Summary and Critical Reflection
This close reading is a summary and critical reflection on Graham et al’s paper “Toward a study of information geographies”[1]. In today's day and age people capitalise on the value associated with knowledge validation and information control. This is greatly due to the fact that information and power are intimately intertwined. Information is also highly mobile and adaptable, which can sometimes change the original meaning behind the data:
It is precisely this mobility and adaptability of information that provides the motivation to constrain the mutability of information through the creation of what Latour [2] refers to as ‘immutable mobiles’: or information that can be transported without significant change to its inherent characteristics or meaning[1].A particular type of information augmentation that is focused on in this paper is that of geographic augmentation. Geographic augmentations do not simply define a place, but rather shape it. This is a problem because if a place is the site of political contestation, then different narratives will be imposed on the place, resulting on augmentations that may not reflect reality/the truth.
Information has always had geography. It is from somewhere; about somewhere; it evolves and is transformed somewhere; it is mediated by networks, infrastructures, and technologies: all of which exist in physical, material places[1].
Thus, not only does information have particular geographies, but geography itself is layered, defined, and augmented by information that is more or less immutable [i.e. both mutable and immutable: or (im)mutable] depending upon the institutions and practices associated with it [3].
Pre-digital Geographies of Information
In the past, large scale data collection was not possible for the every day person since only few people and/or places had the actual tools (e.g. compasses, paper, sextants) for collecting data about places. On top of this, the tools for collecting such data could only be used at the actual site (close to the object of measurement). Since the obvious medium for containing information in the pre-digital age was the book, there was the additional problem of the fact that not just anyone could read a book, let alone write a book. To read a book, you had to own one (which only the very wealthy could afford) or you had to visit a library. The actual process of reading is also very linear since books all come in pre-specified forms. To produce a book, very specific “points of access to codified content” [1] were required. In this, the print era, pretty much only maps or books were available for people to access geographically referenced information. Further, in order to manage, validate, merge, modify, classify, sort, analyse and manipulate information into particular forms and formats [1], there was a high skillset required – and only universities, associations and guilds had the required resources. As the paper says, "these geographic centres of calculation meant that the ability to access codified information, let alone contribute to it (i.e. the professionalisation of knowledge work) was also highly constrained" [1].Although the affordances of pre-digital technologies (and their associated systems of governance, economisation, and socialisation) allowed for movements of codified information (shifted from its point of creation to other locations), it could never transcend the innate materiality of its medium or the world[1].Since these strict structures (universities, associations and guilds - all arguably controlled by the government/power structure) were in place for the learning or producing of codified information, it can be said that these were always produced under conditions of power and that hegemonic representations has been a way of exerting economic, social, and political power [4].
Books, newspapers, and patents, for instance, were all far more likely to be published from (and about) the global North: with the global South playing a relatively minor role in producing, using, and controlling codified information[1].This above statement highlights the exponential "information" divide that has is apparent between the "North" and the "South". Today, this has worsened further into an extreme (and definitely still exponential) digital divide. Most of Africa is being left in a technological apartheid [5] with South Africa being one of the few exceptions. However, with that being said, within South Africa itself there are massive digital divides amongst the population.
Changing Geographies after the Information Revolution
The terms ‘information revolution’ [6] and ‘data revolution’ [7] signify the radical changes in the ways that information is produced and used: implying that we are now in an age of post-information scarcity.Wikipedia said: Post-scarcity is a theoretical economic situation in which most goods can be produced in great abundance with minimal human labour needed, so that they become available to all very cheaply or even freely.
The article mentions that:
Many of the barriers to the production, processing, and proliferation of information in the pre-digital era have been drastically lowered[1].It is argued that this is because of greater accessibility to computers that can readily receive and transmit information. This does mean that many every-day persons no longer require proximity to the above-mentioned (in the Pre-digital Geographies of Information section) institutions in order to gain knowledge and engage with, or produce, information. This is quite simply due to the power of all things digital, or more specifically, the internet. This digital method of participation and representation in academics, knowledge, data (and even power) circumvents the more traditional mediators of such information, which allows citizens to play a more significant role in shaping the content and augmentations that play key roles in their lives[1]. However, as George Orwell likes to say, "all animals are equal… but some are more equal than others [8]. Just because people with access to the digital world are able to better play a more significant role in the ‘content and augmentations’ in their own lives, does not mean that all citizens can actually do such things. The quote above is extremely broad and can only really be applied to first world countries, and not liberally at that.
FIGURE 1:
Digital 2020 South Africa (January 2020) v0 from DataReportal
In South Africa, a lower percentage of people have access to the internet than many other more developed countries. As seen on slide 17 of figure 1 above, only 62% of South Africans use the internet. Slide 21 shows that of these people, only 76% own a laptop or desktop computer - compared to the 94% that own a smartphone. This means that a lot of South Africans either do not have internet access, or do not have access to a laptop or computer (which is almost always required in order to have 'productive' access to the internet).
While smartphones have come a long way, it is still much harder to try process and learn information and knowledge on a smartphone as compared to a laptop/computer, let alone produce or contribute to such information or knowledge. Thus, what I meant by ‘productive’ access is access to the digital world that actually allows the said citizen to play a more significant role in shaping their digital. While smartphones are able to use map/geographical data and perform basic online searches for the user to absorb and learn information, it is not possible to effectively contribute/participate in the digital world (manage and own domains, contribute to GitHub or Wikipedia as only a few examples).
Harvard Law Professor Lawrence Lessig pointed to the significant possibilities afforded by the Web: ‘[f]or the first time in a millennium, we have a technology to equalize the opportunity that people have to access and participate in the construction of knowledge and culture, regardless of their geographic placing’ [9].
I don’t know if the recent pandemic has caused my outlook on life to become too critical or pessimistic, but I do not share Prof Lessig’s hope. While I do agree that we have the technology to equalize the opportunity people have of accessing the digital world, I completely disagree that “regardless of their geographic placing”. How can you say it is “regardless of their geographic placing” if such technology is simply not available to millions of people DUE to their geographic placing? The cycle of poverty is one that cannot be broken by the availability of technology in a first world across the ocean.
Again, in 2012 the Secretary-General of the International Telecommunication Union claimed that once internet connectivity arrives, ‘all the world’s citizens will have the potential to access unlimited knowledge, to express themselves freely, and to contribute to and enjoy the benefits of the knowledge society’ [10].
I call (っ◔◡◔)っ ⬧︎bull𝔰𝔥𝔦𝔱⬧︎. Simple as that. There is too much emphasis on the word “potential”.
If I’m living in a squatter camp, with incredibly fast 5G swirling in the air around me, I might not even be able to afford to connect to it, let alone be able to “access unlimited knowledge”. I won’t be looking to “express myself freely” because I am2 too poor to afford food. I cannot “contribute to and enjoy the benefits of the knowledge society” because I cannot read or write.
I understand that this survey and resulting paper is in order to answer these questions and concerns, and I respect the work done, and the new beginning that the report is trying to create. The authors themselves state that due to the diverse range of data sources, this analysis raises far more questions than it answers – which is their intent.
This paper explores how information geographies have their own geographic distributions:
- Geographies of access and enablement (i.e. an exploration of who has access to the technologies and services essential for digital communication, participation, and representation).
- Geographies of participation (i.e. where digital information is generated).
- Geographies of representation (i.e. for which parts of the world is content created and not created).
In contrast, much of the data used in this paper were generated using bespoke data collection tools and are tightly focused on the geography of one particular manifestation of information (and therefore rarely, if ever, used previously)[1].
For this article we limit ourselves to the scale of the country, an admittedly problematic construct given the diversity of country sizes, numerous border [1] and definitional issues and, perhaps most significantly, the obscuring of the fundamental urban nature of information generation.
Geographies of access and enablement
Since internet access is a prerequisite for most types of digital engagement, the rate of internet access is “key to illustrate global patterns of (dis)connectivity” [1]. In the graph BELOWABOVE, the population of a country that has access to the internet is demonstrated by the size of each country depicted on the graph. Further, the population penetration of each country (percentage of population that have internet access) is demonstrated by the colour of the country, with the darker red colours demonstrating high internet penetration percentages.
FIGURE 2:
Internet Population and Penetration from The Oxford Internet Institute
The paper notes that Asia is home to the world’s largest internet population (42%) – which, in other words, means that China, India and Japan together have a larger internet population than the whole of Europe and North America combined.
Another interesting observation that can be made about each country using this data and graph is that of the proportion of a country’s actual population to country’s internet population. This is interesting because, for example, India has very large number of internet population, and yet they still have less than 20% of their population on the internet – this means that there is substantial room for growth. It can be seen that very few countries with a large populous also have a high internet penetration rate.
Africa is tiny on this map, demonstrating just how little internet penetration there is within most of the continent.
It is thus key to remember that despite the massive role of the internet in everyday life in Western Europe – where this paper was written and published – most people on our planet remain without access[1].
The paper then highlights another vital part of access to the digital world – the relative cost of an internet connection. This is one of the biggest barriers with regards to the global digital divide. The reason this particular figure is so important, is because it does not just show the actual cost of internet connectivity per country, but instead it shows the relative cost by displaying it as a percentage of average income. This is so important since, for example, Europe and North America have high absolute costs, ranging between about US$10 and 40 a month, but since they both contain mostly first world countries (with minimum wages being so much higher) this “expensive” internet cost is actually **relatively** very low – “a couple of hours of work a month is sufficient for an average worker to afford the cost of connectivity.” Compare this to Eritrea, where a yearly subscription costs the equivalent of almost 50 years of an average salary: an entire life of work for a year of broadband internet access. The countries coloured in dark red on the figure BELOWABOVE are countries in which a broadband subscription costs ONE HUNDRED percent of a person’s average income.
Basically – citizens have to decide between internet access, and life (food, shelter, transport, etc.) as they very simply cannot afford both. Tell me again how your first world technologies are equalizing the opportunity that people have to access and participate in the construction of knowledge and culture, regardless of their geographic placing. Tell me again how this internet connectivity, which has arrived, will allow citizens of such a country to access unlimited knowledge, to express themselves freely, and to contribute to and enjoy the benefits of the knowledge society.
Only five sub-Saharan African countries can obtain broadband connections for less than 10% of their incomes. However, as the paper states, the issue is more the low average incomes of Africans rather than high broadband costs.
FIGURE 3:
Broadband Affordability from The Oxford
Internet Institute
The Geographies of Participation
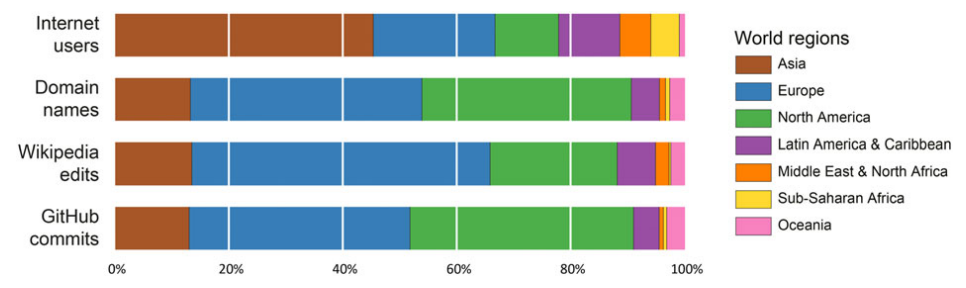
The next section of the paper aims to understand the geographies of participation. Thus, three different variables are explored: domain names (as an indication of content produced on the open Web), GitHub users (as a measure of contributions to the world’s largest open software repository), and Wikipedia edits (as a measure of contributions to the world’s largest open encyclopaedia) [1].
While I agree that this is very useful information to collect and analyse, I must once again stress that in most countries, especially in Africa, a high percentage of the populous do not have access to devices which would allow for this level of participation in the digital world, let alone the knowledge of HOW to do so. This only reminds us that while the data shown in this paper is already skewed, in ‘real terms’ it is in fact even MORE skewed than what is demonstrated.
The Geography of Domain Names
Domains are useful providing a proxy for the location of digital content since they are employed as a key ‘building block’ of the internet [11] as they provide a key means by which users navigate. Although data transverse the internet via IP addresses (such as 91.198.174.1926 ) these numerical addresses are difficult for people to remember, which led to the creation of the domain name system in the 1980s[1].
Figure 3 shows the distribution of the two principle types of domain names: generic Top-Level Domains (gTLDs) such as .com or .org and country code Top-Level Domains (ccTLDs) associated with specific countries (for instance, .de for Germany and .ke for Kenya). Both types of domain names require formal registration and information gathered during the processes (such as country location) is accessible through a variety of internet utilities such as whois or dig which were utilised to construct this dataset.
FIGURE 4:
Geography of Top-Level Domain Names from The Oxford Internet Institute
The cartogram in Figure 3 depicts any country that is home to more than 10 000 gTLD and ccTLD domains as a red circle. The area of each circle is sized according to the number of domain names registered in that country and the shading of each circle indicates the internet population of a country used in Figure 1. Therefore, a small, dark circle (like India or .in) indicates that the country is home to a large population of internet users, but a relatively small number of domains. In contrast, a larger, light circle (like Sweden, .se) indicates that a country is home to a relatively small internet population, but many domain names.
Figure 3 shows that the majority of domains (78%) are registered in Europe or North America: a finding that highlights the dominance of those two regions in terms of internet content production. Asia, in contrast, is home to only 13% of the world’s domains while Latin America (5%), Oceania (3%), and the Middle East and Africa combined (2%) have even smaller shares of the world’s websites.
| Country | Domain Names | Internet Users |
|---|---|---|
| USA | 1 | 3 |
| Netherlands and Switzerland | 2 | 3 |
| Western Europe | 5 | 3 |
| China | 40 | 3 |
| Middle East and Africa | 50 | 3 |
A key take-away from this geography of content production is that large internet populations do not automatically translate into large numbers of domain registrations (e.g. India or China). In other words, there appears to be large differences between access to information and participating in its creation and distribution.
Distributions of Collaborative Coding
Of course, domain names are but one possible metric for participation and thus it is important to also review other possible indicators of content production[1].
GitHub is the largest code hosting service in the world, containing 17 million repositories and having 3.5 million registered users (as well as countless more unregistered users). Programmers can use GitHub to publish their code for others to download and use, and to collaboratively work on shared projects, tracking changes and contributions. No other code hosting service has remotely the same number of users, making GitHub a useful proxy for the extent to which internet users create and share code.
FIGURE 5:
GitHub: Mapping Collaborative Software from The Oxford Internet Institute
In sum, just as domain names were disproportionally concentrated within Europe and North America, this more direct measure of content creation and distribution is also skewed. While not as dramatic, it is arguably more profound given the nature of the contributions, not simply websites but software, the lifeblood of the information age. This analysis of GitHub shows that these regions are significantly more involved in collaborative code development than other parts of the world: with Africa and the Middle East containing considerably fewer people accessing or contributing software than would be expected given the level of internet access.
I was impressed that this paper noted that while “code is central to the functioning of contemporary societies, its creation is a particularly specialised endeavour” [1] and therefore also looked at the contributions made towards Wikipedia since it is “an open platform that allows all internet users to contribute” and “offers an indicator of a more generalised level of content creation and contribution”.
Wikipedia is an extremely popular website as it is the world’s largest and most used encyclopaedia. It
exists in 282 languages, with 40 of those language versions containing more than 100 000 articles. In other
words, as the paper states, edits to Wikipedia have tremendous power to shape content accessed by the
majority of internet users around the world. Wikipedia’s strap line is ‘the free encyclopaedia that anyone
can edit’ which, in theory, means that anyone with an internet connection can contribute to the site.
However, Figure 5 shows that the average number of edits per month in 2014 is highly uneven across the
world.
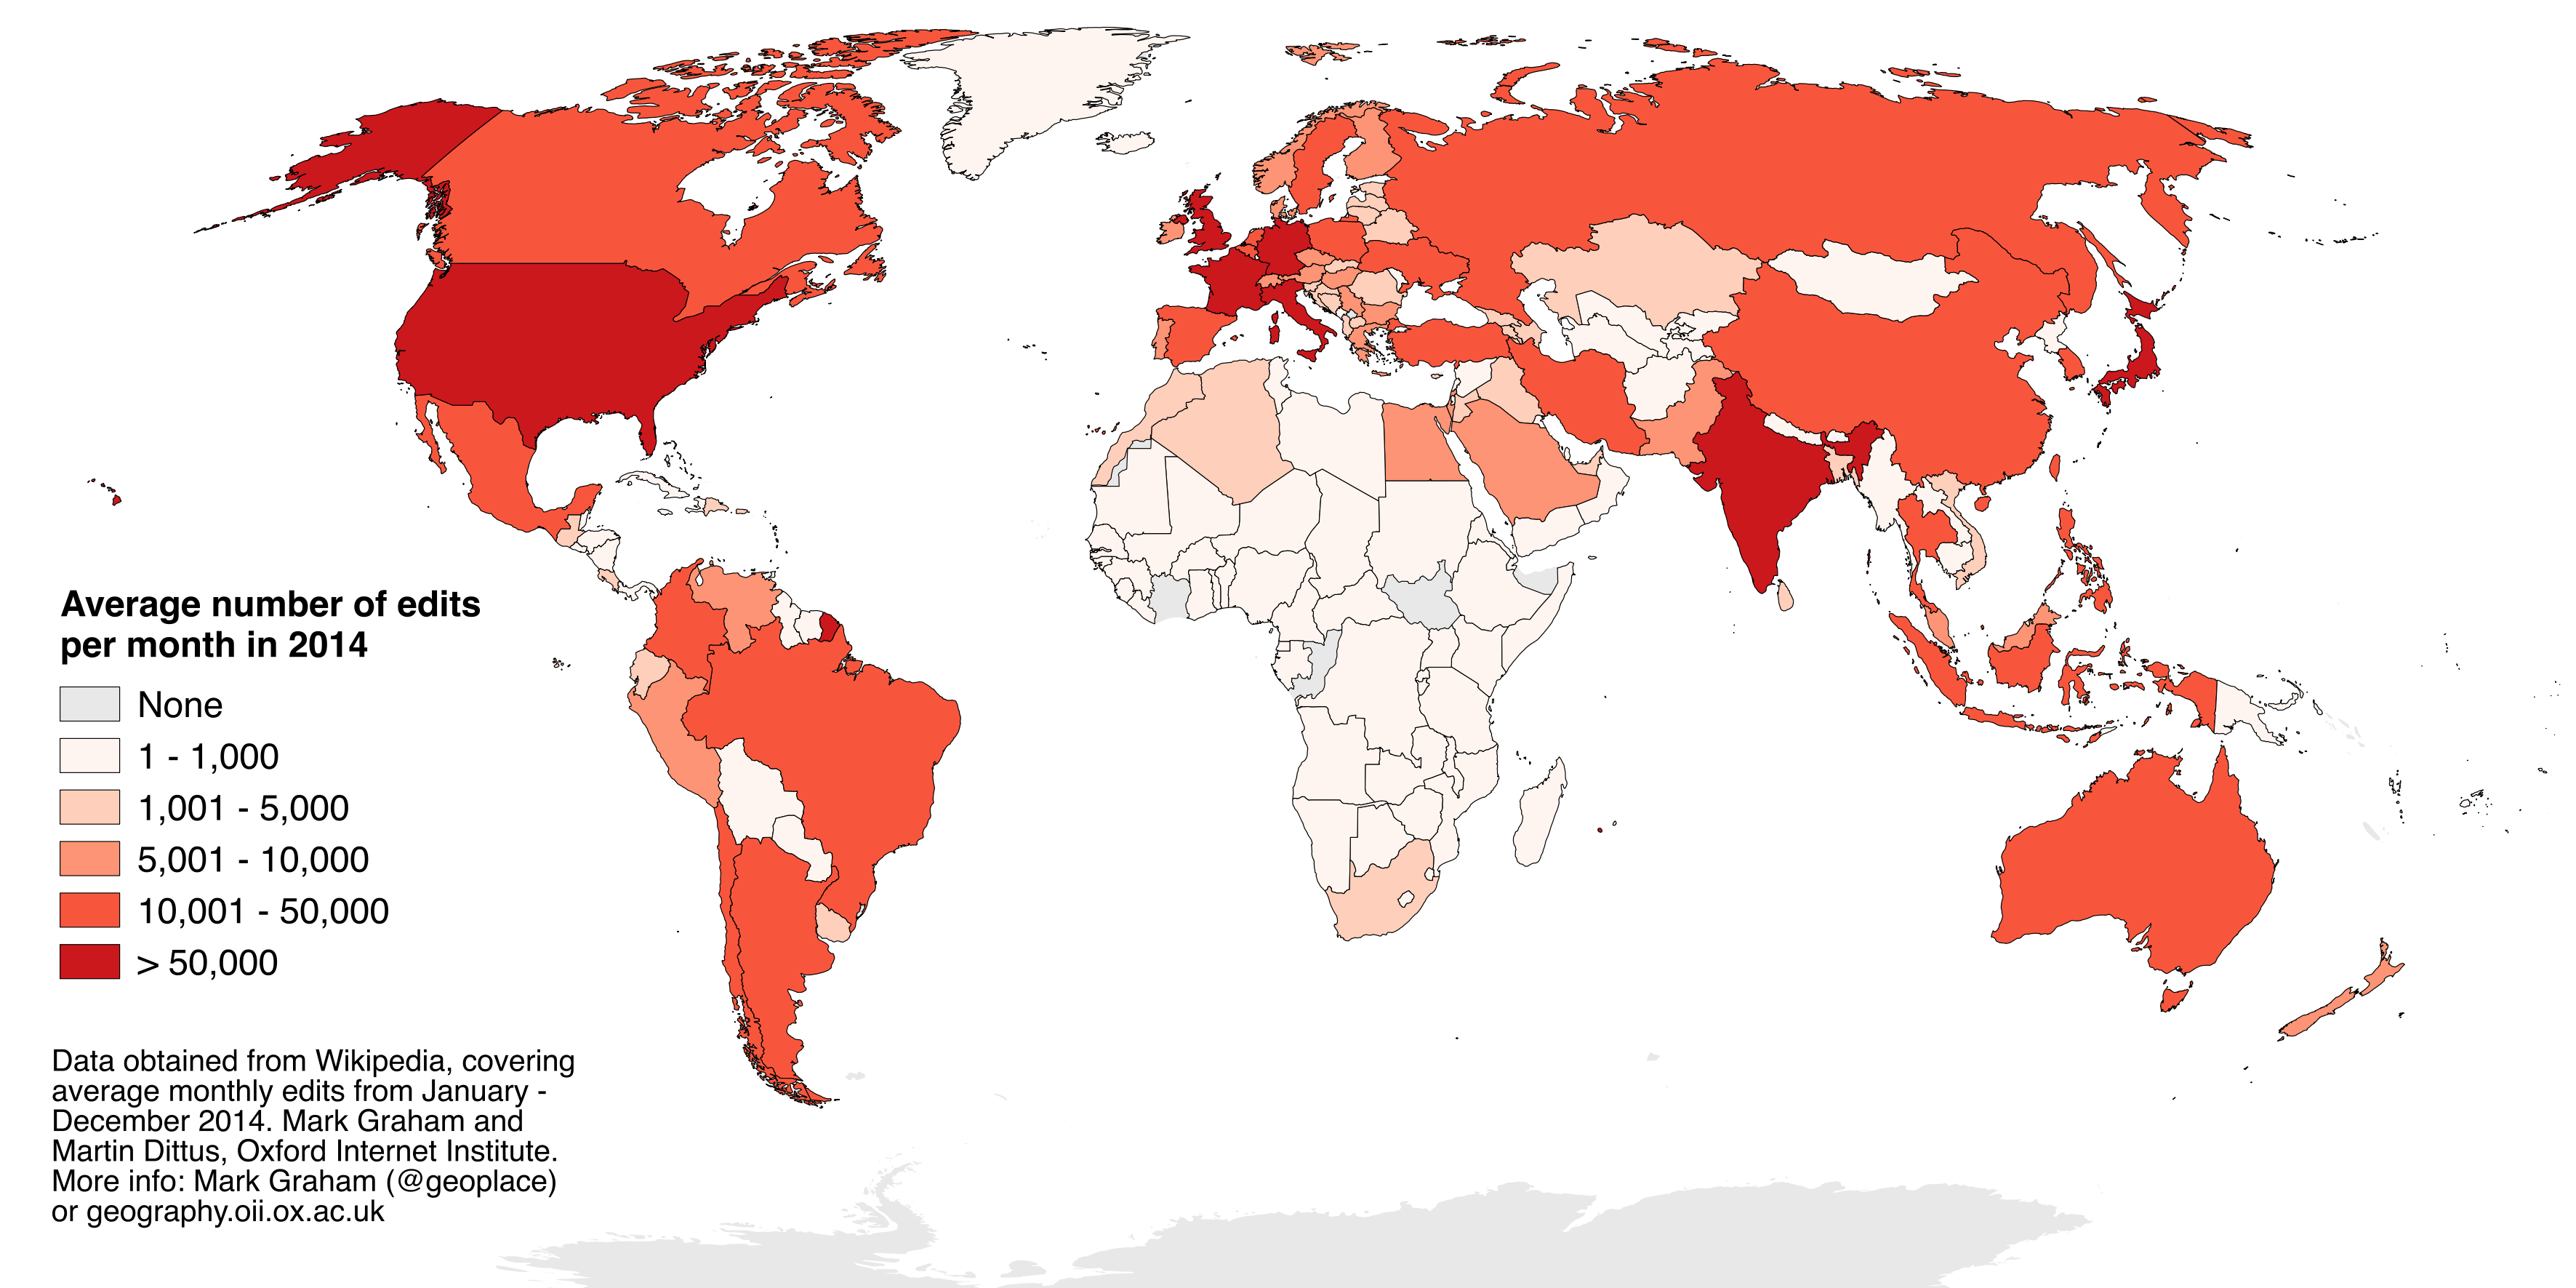
An interesting comparison was made in the paper: the contributions from Africa are so low that there are actually more edits originating in Hong Kong than in the whole of Africa. The paper notes that some of these disparities can be explained by the total number of internet users in a country, however, even normalising by the percent of the population online, Africa still registers less edits than expected. More African statistics include the fact that only 16% of Nigerian content, and 9% of Kenyan content is created by locals (compared to the 85% and 78% of the United States and United Kingdom respectively).
The global North is characterised by the greatest levels of participation and is creating the bulk of digital content, while the global South contributes very little. Africa, in particular, is almost entirely omitted from these processes of digital generativity[1].
Geographies of Representation
Google Searches
Since Google is the world’s most used search engine, the geographic content (or lack thereof) of a particular place within a Google search will significantly impact the representation of the said place. The size of each rectangle in the tree map in FIGURE XXXXX, represents the number of retrieved pages mentioning that country – with the colour of that country corresponding to it’s region in the world, while the shade of the colour representing the number of web pages per internet user (with the dark shade being a high number). As mentioned in the paper, the most interesting result from this analysis is that Google indexes a relatively large number of pages about even the smallest and most sparsely populated territories[1].
FIGURE 8:
Geographies of Google search from The
Oxford Internet Institute
Mapping OpenStreetMap
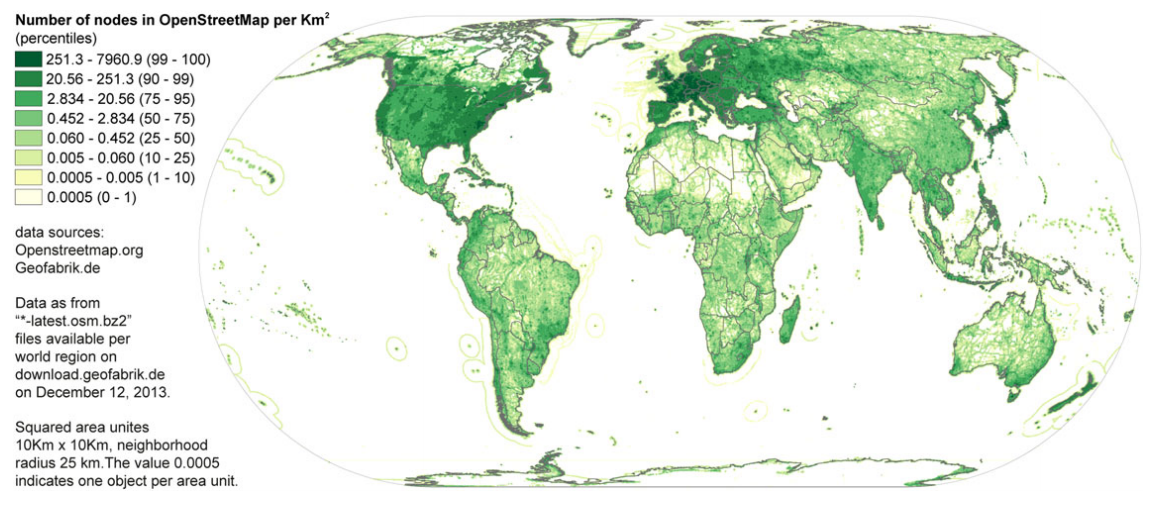
OpenStreetMap (OSM) is the world’s largest free and open source road map, and it is thus used as a base map
for thousands of other digital platforms and services. As seen in the figure, similar patterns in terms of
access (or lack there-of) to information geographies arise even with something as “simple” as a digital road
map. Again, if a person doesn’t own a smartphone, then they immediately cannot even access such digital
maps, let alone make use of them.
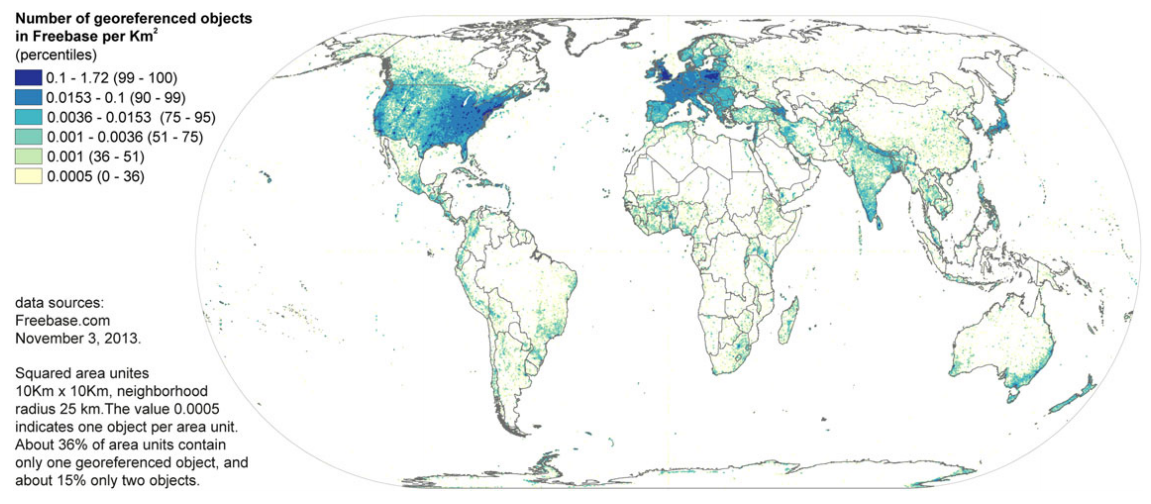
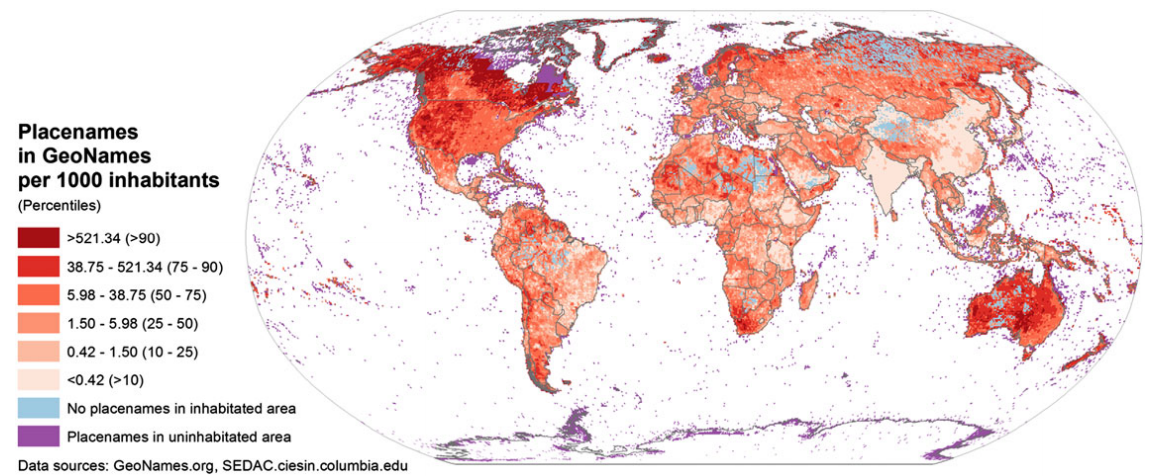
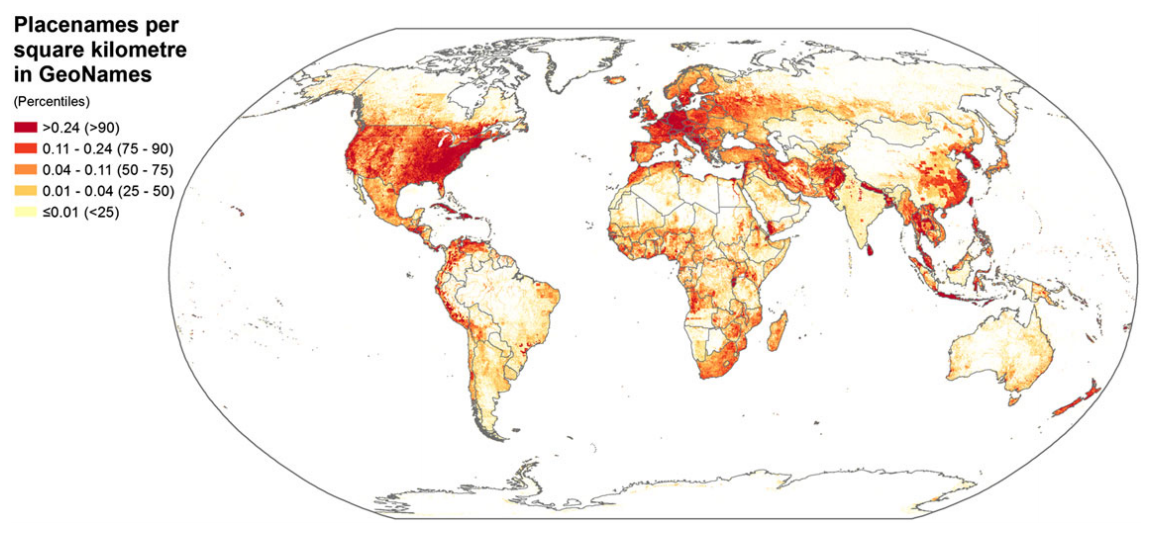
The Contours of the Semantic Web: Freebase and Geonames
Google’s ‘Knowledge Graph’ is used to not only display the simple list of search results (links to websites), but also to display structured additional information about a user’s query (search) on the right-hand side of the search page. Since Google is the largest search engine in the world – and thus the primary web interface for most people – the way in which their ‘Knowledge Graph’ depicts information will play an important role in how millions of people interpret the world. This is an example of the semantic web, which pulls information from centralised databases, and feeds it into internet services such as Google, Facebook, etc. The two back-end databases for the semantic web that this paper studied included:
- Freebase: General-purpose knowledge base, containing a database of tens of millions of entities (including many geographic ones).
- Geonames: World’s largest directory of place names.
However, some surprising exceptions were found, for example:
- Nepal:
- Has more content than all but 10 other countries.
- Contains more place names than India and the United Kingdom together.
- It is suspected that this is tied to the significant efforts of a 2001 project funded by the European Union (Budhathoki and Chhatkuli 2004) to create a geographical information infrastructure in Nepal.
- Iran: has almost as many place names as Germany.
- North Korea and Sri Lanka are referenced in almost as much detail as Austria.
- Haiti has more content than Denmark (likely as a result of work done following the 2010 earthquake in the country).
It is likely that some of these patterns appear because many of the place names for locations outside of North America and Europe are sourced from the US National Geospatial-Intelligence Agency and therefore reflect the interests of the US intelligence services.
Conclusions: Towards a Study of Information Geographies
Through this effort, the paper demonstrates that in addition to uneven geographies of access to contemporary modes of communication, uneven geographies of participation and representation are also evident and are in some cases being amplified rather than alleviated[1].The paper summarises that even though there are new “policy makers” and new technologies, there are still few signs that the outliers of the global information world are “not achieving comparable levels of participation or representation with traditional information cores” [1]. Despite the fast-paced spread of internet throughout the world (to approximately 3 billion people), it can be seen that the global North is producing – and is the subject of – exponentially more content than the global South.
Despite this rather gloomy summation, we see this work as a beginning rather than an end as well as part of an effort to confront these stubborn realities[1].The paper notes that more attention should focus on:
- The impacts of post-colonial modes of informational governance.
- Wikipedia says that information governance balances the risk that information presents with the value that information provides.
- The culturally contingent ways through which participation and representation take place.
- Shifts in the political economy of control of geographic information [12].
- The affordances of platforms and infrastructures of connectivity.
- The constraints of explicit and implicit censorship.
- Gendered or classed constraints to access or production.
- The availability or absence of a broader information ecosystem of geographic content.
It will entail deconstructing, disentangling the mutability and immutability of information, mapping, and interrogating the geographies of information and asking critical questions about power over what is made visible and invisible within information geographies: What is shown? Where is it shown? To whom is it shows? And how do we ultimately bring about more inclusive, less uneven, and more just information geographies?[1]The graphs and data in this paper show an alarming digital separating between the "global North" and the "global South", and this gap is not getting smaller by any means. Some interesting trends have arisen - such as some countries in digitally scarce continents slowly building up their own digital worlds - and this is enough to cause hope for the future; if only governments and power-holders were motivated to try and make a change. South Africa is definitely a beacon of light in the digital darkness that has been cast over Africa, however, we still have a long way to go before all people are able "access unlimited knowledge, to express themselves freely, and to contribute to and enjoy the benefits of the knowledge society"[10].
References
- M. Graham, S. De Sabbata and M. Zook, “Towards a Study of Information Geographies: (Im)Mutable Augmentations and a Mapping of the Geographies of Information,” Geo: Geography and Environment, vol. 2, no. 8, pp. 88-105, 2015.
- B. Latour, “Visualization and Cognition: Thinking with Eyes and Hands,” Knowledge and Society: Studies in the Sociology of Culture Past and Present, vol. 6, pp. 1-40, 1986.
- C. Perkins, “Plotting practices and politics: (Im)mutable narratives in OpenStreetMap,” Transactions of the Institute of British Geographers, vol. 39, pp. 304-317, 2014.
- E. Laclau and C. Mouffe, Hegemony and socialist strategy: towards a radical democratic politics, London: Verso, 1985.
- M. Castells, “Information Technology, Globalization and Social Development,” in United Nations Research Institute for Social Development, Geneva, 1999.
- L. Floridi, The philosophy of information, Oxford: Oxford University Press, 2011.
- R. Kitchin, The data revolution: big data, open data, data infrastructures and their consequences, London: Sage, 2014.
- G. Orwell, Animal Farm, New York: Signet Classics, 1996.
- L. Lessig, “An information society: free or feudal,” in World Summit on the Information Society, Geneva, 2003.
- H. Touré, “U.N.: we seek to bring internet to all,” Wired, nd, 2012. [Online]. Available: www.wired.com.
- M. Zook, “Old hierarchies or new networks of centrality?,” American Behavioural Scientist, vol. 44, p. 1679–1696, 2001.
- A. Leszczynski, “Situating the geoweb in political economy,” Progress in Human Geography, vol. 36, p. 72–89, 2012.